Hourglass Chart
Compare category values across two scenarios to showcase conversions | Power BI certified
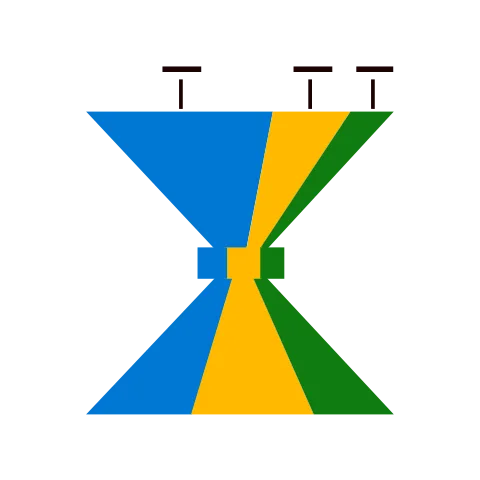
Visual at a glance
- Category
- Comparison
- Certification
- Power BI Certified
- Best used for
- Compare category values across two scenarios to showcase conversions | Power BI certified
About Hourglass Chart
Hourglass Chart by MAQ Software enables you to compare category values between two scenarios. To understand changes in your data categories, Hourglass Chart offers a customizable conversion rate bar and is useful for any scenario where you need to compare data before and after an event takes place, especially across multiple categories.
Key Feature
- Categories can be highlighted upon clicking
- Configurable horizontal/vertical orientation
- Animated individual categories on hover
- Configurable conversion box (add or remove)
Business uses
- Social media marketing: Track the ROI of A/B testing across social media platforms
- Marketing: Analyze revenue for products before and after a major promotion
- Travel: Compare the number of scheduled flights versus delayed flights between major airports
Feature walkthrough
Contact Us. Thank you for using Hourglass Chart by MAQ Software. Have questions about this or any of our other Power BI custom visuals? For issues, contact Support@MAQSoftware.com. For priority requests or custom builds, contact CustomerSuccess@MAQSoftware.com.
FAQs
What is the Hourglass Chart visual used for?
The Hourglass Chart visual helps compare category values across two scenarios, such as before and after an event, source versus destination, or planned versus actual performance.
What data fields are required?
The visual requires category values for two comparison scenarios and supports the display of conversion rates or value changes between them.
Can I customize the appearance of the Hourglass Chart?
Yes. You can configure:
- Orientation
- Conversion box settings
- Category highlighting
- Other formatting options
Can I switch between horizontal and vertical layouts?
Yes. The visual supports configurable horizontal and vertical orientations to fit different report layouts.
Can categories be highlighted?
Yes. Categories can be highlighted on click, making it easier to focus on specific data points.
Does the visual provide interactive animations?
Yes. Individual categories can be animated on hover to improve user engagement and data exploration.
What is the conversion box used for?
The conversion box helps visualize conversion rates or changes between two scenarios. It can be added or removed based on reporting needs.
Which business scenarios is this visual best suited for?
Common use cases include:
- Marketing campaign analysis
- A/B testing performance
- Revenue comparison before and after promotions
- Travel operations analysis
- Conversion tracking
Can the visual be used to show conversion rates?
Yes. The Hourglass Chart is specifically designed to help showcase conversions and changes between two related datasets.
Is the Hourglass Chart visual responsive?
Yes. The visual automatically adjusts to different report sizes and dashboard layouts.
What are the key features of Hourglass Chart?
Key features include:
- Category highlighting
- Configurable orientation
- Hover animations
- Configurable conversion box
Is Hourglass Chart certified by Microsoft?
Yes. Hourglass Chart is a certified Power BI custom visual and meets Microsoft certification requirements.
Where can I report issues or request new features?
For support, bug reports, or feature requests, contact customersuccess@maqsoftware.com.