Circular Gauge
Illustrate your progress toward goals in a pie or donut chart | Power BI certified
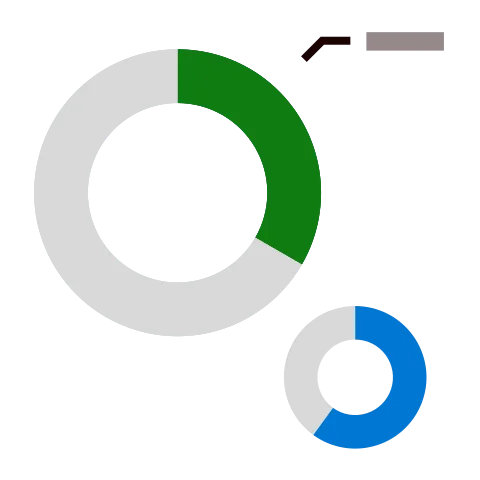
Visual at a glance
- Category
- Comparison
- Certification
- Power BI Certified
- Best used for
- Illustrate your progress toward goals in a pie or donut chart | Power BI certified
About Circular Gauge
Showcase task progression with Circular Gauge by MAQ Software. This visual enables you to display progress as an actual value or as a percentage of the target value. You can also pick between displaying the information in a pie or donut chart format and setting a threshold value.
Key benefits
- One color illustrates actual progress while another displays a set target
- Ability to display percentage of progress against a set target
- Customizable text size and ring size
Use cases
- Sales: Compare your actual yearly sales to a pre-set target
- Marketing: Display key performance metrics such as target conversions and impressions in relation to the actual values
- Human resources: Track the success of internal campaigns by comparing the total number of employees to the amount that have been onboarded
Feature walkthrough
Contact Us. Thank you for using Circular Gauge by MAQ Software. Have questions about this or any of our other Power BI custom visuals? For issues, contact Support@MAQSoftware.com. For priority requests or custom builds, contact CustomerSuccess@MAQSoftware.com.
FAQs
What is the Circular Gauge visual used for?
The Circular Gauge visual displays progress toward a target using a circular indicator. Progress can be shown as either an actual value or as a percentage of the target, making it ideal for KPI and performance tracking.
What data fields are required?
The visual requires an Actual Value and can optionally use a Target Value to calculate and display progress toward the goal.
Can I display the visual as a pie chart or a donut chart?
Yes. The Circular Gauge can be displayed in either a Pie Chart or Donut Chart format based on your reporting requirements.
Can I customize the appearance of the Circular Gauge?
Yes. You can customize:
- Progress colour
- Target colour
- Text size
- Ring thickness/size
- Visual layout and appearance
Can I display progress as a percentage?
Yes. The visual can display progress as a percentage of the configured target value, helping users quickly assess performance.
Does the visual support threshold values?
Yes. You can configure threshold values to compare actual performance against predefined limits or targets.
Which business scenarios is this visual best suited for?
The Circular Gauge visual is commonly used for:
- Sales target tracking
- Marketing campaign performance
- KPI monitoring
- Employee onboarding progress
- Goal completion tracking
- Operational performance measurement
Can I compare actual values against target values?
Yes. The visual allows you to compare actual values against target values using separate indicators for progress and target achievement.
Is the Circular Gauge visual responsive?
Yes. The visual adjusts to different report layouts and sizes, helping maintain readability across dashboards.
Is Circular Gauge certified by Microsoft?
Yes. The Circular Gauge visual is certified by Microsoft and complies with Microsoft's certification requirements for Power BI custom visuals.
Where can I report issues or request new features?
For support, bug reports, or feature requests, contact: customersuccess@maqsoftware.com. We regularly update the visual with enhancements and bug fixes.