Cylindrical Gauge
Compare metrics against a target value or capacity with an intuitive 3D visual | Power BI certified
Visual at a glance
- Category
- Comparison
- Certification
- Power BI Certified
- Best used for
- Compare metrics against a target value or capacity with an intuitive 3D visual | Power BI certified
About Cylindrical Gauge
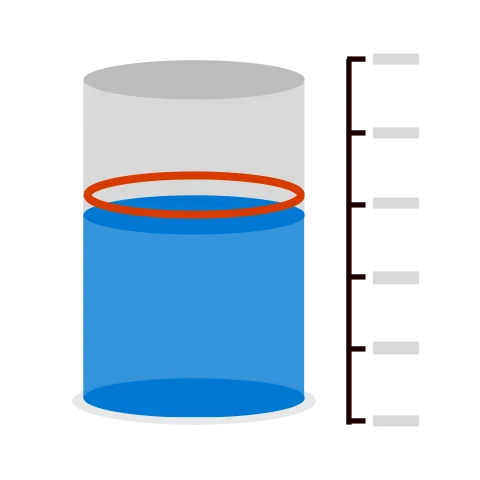
Compare actual values against a target capacity with Cylindrical Gauge by MAQ Software. Easily visualize progress towards a goal. Each gauge in this visual represents a single metric.
Key benefits
- Customizable minimum and maximum values of the tick marks
- Customizable fill and border color
- Vertical scrollbar for when height restrictions limit visibility
- Optional fill line for added clarity
Use cases
- Inventory: Evaluate inventory to forecast future needs
- Marketing: Analyze average customer satisfaction scores
- Travel: Evaluate fuel levels across different journey routes
What's new
- Applied the missing maximum limit to the Format Pane settings to ensure proper configuration control.
Feature walkthrough
Contact Us. Thank you for using Cylindrical Gauge by MAQ Software. Have questions about this or any of our other Power BI custom visuals? For issues, contact Support@MAQSoftware.com. For priority requests or custom builds, contact CustomerSuccess@MAQSoftware.com.
FAQs
What is the Cylindrical Gauge visual used for?
The Cylindrical Gauge visual helps compare actual values against a target value or capacity using an intuitive 3D cylinder representation. Each gauge displays a single metric and its progress toward a goal.
What data fields are required?
The visual requires an Actual Value and supports configurable Minimum and Maximum values to define the gauge scale.
Can I customize the appearance of the gauge?
Yes. You can customize:
- Fill color
- Border color
- Minimum and maximum values
- Other display settings
Can I set my own minimum and maximum values?
Yes. Tick mark ranges can be configured manually to suit your reporting requirements.
Does the visual support color customization?
Yes. Both the fill color and border color can be customized to match report themes and branding.
What is the vertical scrollbar feature used for?
The vertical scrollbar helps users navigate the visual when height restrictions limit full visibility of the gauge.
Can I display the fill value separately?
Yes. An optional fill line value can be displayed below the cylinder to provide additional clarity.
Which business scenarios is this visual best suited for?
The visual is commonly used for:
- Inventory management
- Customer satisfaction analysis
- Fuel monitoring and capacity tracking
- KPI measurements
- Operational performance monitoring
Is the Cylindrical Gauge visual responsive?
Yes. The visual automatically adapts to different report layouts and screen sizes.
What are the key features of Cylindrical Gauge?
Key features include:
- Customizable ranges
- Customizable colors
- Vertical scrolling support
- Optional fill line indicators
- 3D gauge design
Is Cylindrical Gauge certified by Microsoft?
Yes. Cylindrical Gauge is a certified Power BI visual and complies with Microsoft certification requirements.
Where can I report issues or request new features?
For support, bug reports, or feature requests, contact customersuccess@maqsoftware.com.