Visual at a glance
- Category
- Single Metric
- Certification
- Power BI Certified
- Best used for
- Represent progress toward goals | PBI certified
About Thermometer
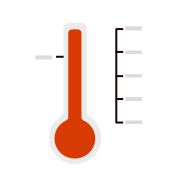
Visualize your progress towards a target goal with Thermometer by MAQ Software. This visual offers you at-a-glance insights into your KPIs.
Key Feature
- Customizable fill and border color
- Editable minimum and maximum values (of the scale)
- The tick bar can be turned off for a minimalist look
Business uses
- Manufacturing - Track inventory levels, throughput, rate of return, maintenance costs, uptime, average delivery time, and average number of shipments
- Human Resources - Track average attendance, employee turnover, and employee satisfaction
Feature walkthrough
Contact Us. Thank you for using Thermometer by MAQ Software. Have questions about this or any of our other Power BI custom visuals? For issues, contact Support@MAQSoftware.com. For priority requests or custom builds, contact CustomerSuccess@MAQSoftware.com.
FAQs
What is the Thermometer visual used for?
The Thermometer visual displays progress toward a target using a familiar thermometer-style chart. It is ideal for tracking KPIs such as sales, revenue, attendance, inventory, temperature, project completion, and other performance metrics.
What data fields are required?
The visual requires an Actual Value to display the current progress. You can also configure the Minimum and Maximum (Target) values to define the measurement scale.
Can I customize the appearance of the thermometer?
Yes. You can customize:
- Fill colour
- Border colour
- Target colour
- Minimum and maximum values
- Display units
- Tick bar visibility
Can I hide the tick marks?
Yes. You can disable the tick bar from the formatting pane to create a cleaner, minimalist appearance.
Can I set my own minimum and maximum values?
Yes. The scale can be configured manually by specifying custom minimum and maximum values that best fit your data.
Does the visual support different numeric units?
Yes. You can display values using Auto, None, Thousands (K), Millions (M), Billions (B), and other supported Power BI display units.
Which business scenarios is this visual best suited for?
The Thermometer visual is commonly used for:
- Sales target tracking
- Budget utilization
- Inventory monitoring
- Manufacturing KPIs
- Temperature measurements
- Employee attendance
- Project progress
- Customer registrations
- Performance against goals
Can the visual display values that exceed the target?
Yes. Values greater than the configured maximum can still be displayed, allowing you to identify when performance exceeds the target.
Is the Thermometer visual responsive?
Yes. The visual automatically adjusts to different report sizes and layouts to provide an optimal viewing experience.
Can I try the Thermometer Visual before I buy it?
Yes. You can evaluate the Thermometer Visual before purchasing it to determine whether it meets your reporting and business requirements. Please visit the product page for more details on available trial and licensing options.
Can I get an estimate/quote?
Further inquiries regarding pricing can be directed to customersuccess@maqsoftware.com
Is Thermometer certified by Microsoft?
Yes. The Thermometer Visual is certified by Microsoft and complies with Microsoft's certification requirements for Power BI custom visuals, ensuring adherence to Microsoft's quality, security, and compliance standards.
Where can I report issues or request new features?
For support, bug reports, or feature requests, contact :
customersuccess@maqsoftware.com. We regularly update the visual with enhancements and bug fixes.