Visual at a glance
- Category
- Clustering
- Certification
- Power BI Certified
- Best used for
- Break down hierarchical data using color coded concentric rings
About Sunburst
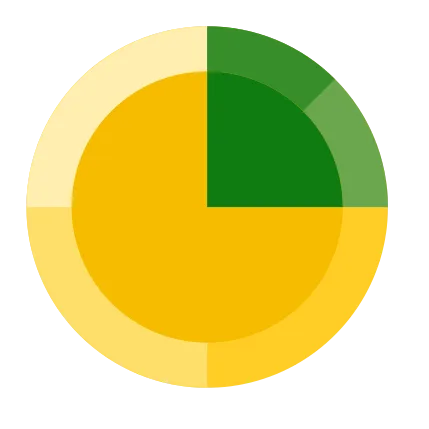
Identify patterns in data that might otherwise go unnoticed. Sunburst by MAQ Software allows users to display hierarchical data as a set of nested rings. Customizable colors make it easy to distinguish between categories. The chart is displayed as a radial tree map or multilevel pie chart, presenting the data as parts of a whole.
Key benefits
- Hierarchical view of grouped categories with an expand/collapse option for each level
- Color-coded concentric rings based on category
- Tooltips for category labels and data values
- Support for date formatting
- Support for context menu
- Interactive with other visuals
Use cases
- Sales – Highlight your sales distribution across multiple demographics and geographies
- International Sales – Identify your most valuable exports broken down by location
- Finance – Break down and understand the revenue sources across your entire business
Feature walkthrough
Contact Us. Thank you for using Sunburst by MAQ Software. Have questions about this or any of our other Power BI custom visuals? For issues, contact Support@MAQSoftware.com. For priority requests or custom builds, contact CustomerSuccess@MAQSoftware.com.
FAQs
What is the Sunburst visual used for?
The Sunburst visual displays hierarchical data using nested concentric rings, making it easy to analyze part-to-whole relationships across multiple hierarchy levels. It helps users identify patterns, compare categories, and explore hierarchical structures through an interactive radial treemap.
What data fields are required?
The visual requires:
- Category/Hierarchy fields to define the hierarchy levels.
- Measure field to determine the size of each segment.
Each additional category field creates another level in the sunburst hierarchy.
What business scenarios is the Sunburst visual best suited for?
The Sunburst visual is commonly used for:
- Sales distribution by region, country, and product
- Financial revenue analysis across departments and business units
- International sales and export analysis
- Organizational hierarchy visualization
- Product category analysis
- Customer segmentation
- Budget allocation analysis
- Market share visualization
Can I customize the appearance of the Sunburst?
Yes. The visual provides several customization options, including:
- Data colors
- Arc appearance
- Detail labels
- Label formatting
- Visual styling options
These settings allow the visual to match your report theme and improve readability.
Does the visual support zooming into hierarchy levels?
Yes. The Sunburst visual supports Zoom-in Animation, allowing users to interactively focus on a selected branch of the hierarchy for deeper analysis.
Does the Sunburst visual support cross-filtering?
Yes. The visual supports Power BI cross-filtering.
Users can interact with:
- Sunburst segments
- Legend values
Selections automatically filter other visuals on the report page and respond to filters applied from other visuals.
Does the visual support Drill Through?
Yes. The Sunburst visual supports Power BI Drill Through, enabling users to navigate from summarized hierarchical data to detailed report pages for further analysis.
Does the visual support report tooltips?
Yes. The visual supports Power BI Report Page Tooltips, allowing additional contextual information to be displayed when hovering over chart segments.
Does the visual support bookmarks?
Yes. The Sunburst visual supports Power BI Bookmarks, allowing report authors to save and restore specific report states while maintaining the current visual configuration.
What makes the Sunburst visual different from a Pie Chart?
Unlike a traditional pie chart, the Sunburst visual can display multiple hierarchy levels within a single visualization. Each concentric ring represents a different hierarchy level, making it easier to analyze complex hierarchical relationships while preserving part-to-whole comparisons.
Which visualization style does the Sunburst use?
The Sunburst visual presents data as a radial treemap (multilevel pie chart), where nested rings represent successive hierarchy levels and segment sizes correspond to measure values.
Is the Sunburst visual responsive?
Yes. The visual automatically adjusts to different report sizes and layouts to provide an optimal viewing experience while preserving hierarchy readability.
Where can I report issues or request new features?
For support, bug reports, or feature requests, contact customersuccess@maqsoftware.com We regularly update the visual with enhancements, performance improvements, and new features based on customer feedback.